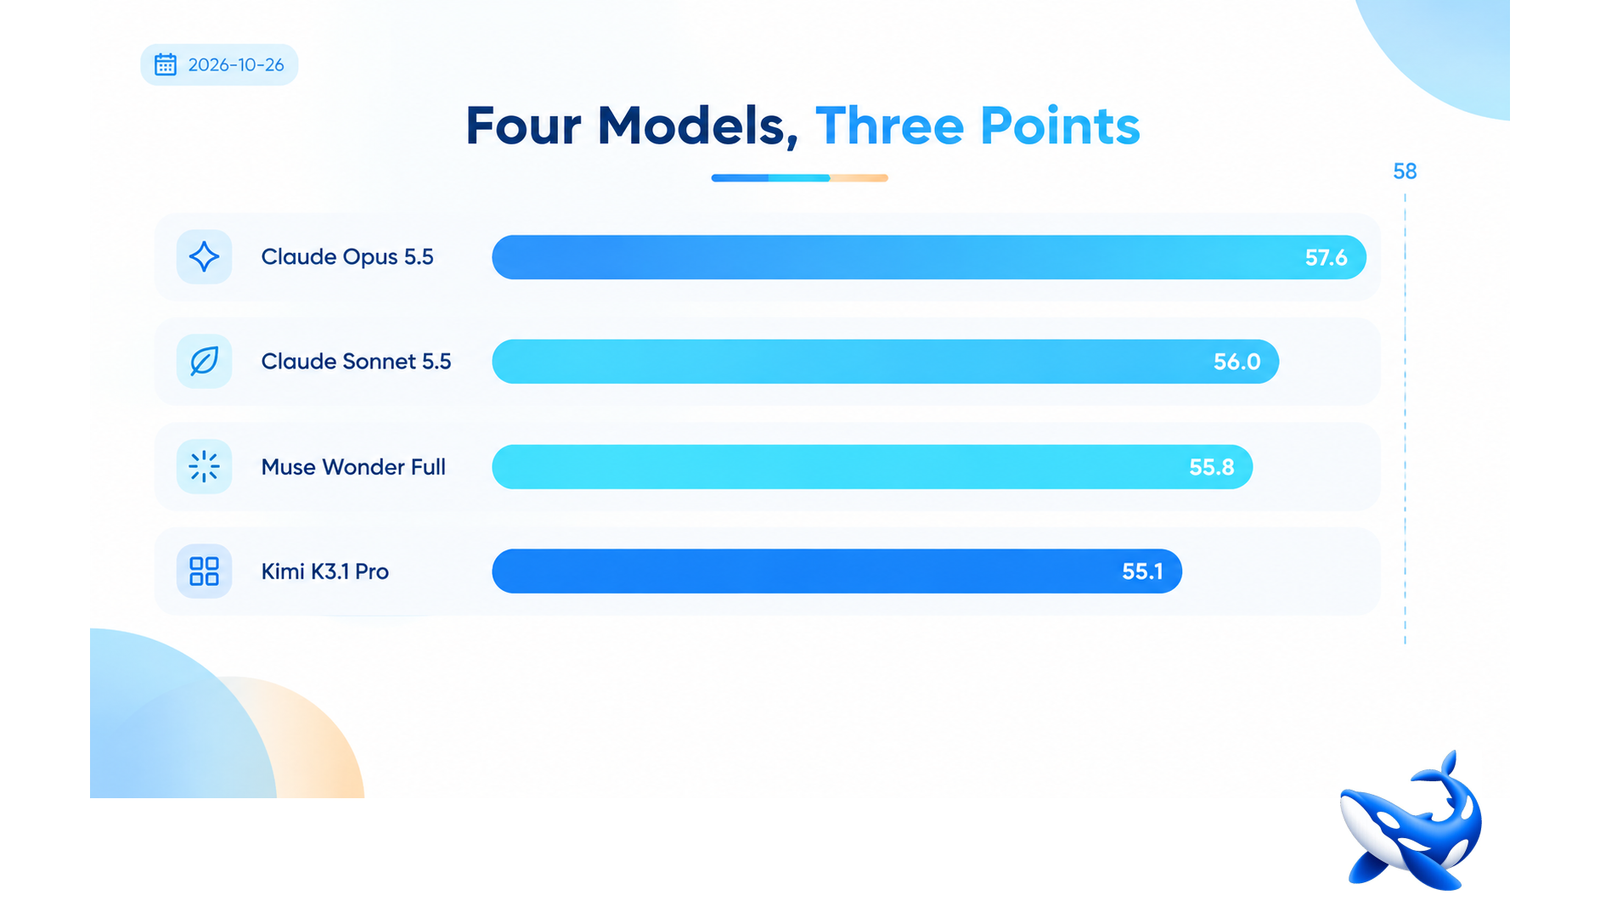

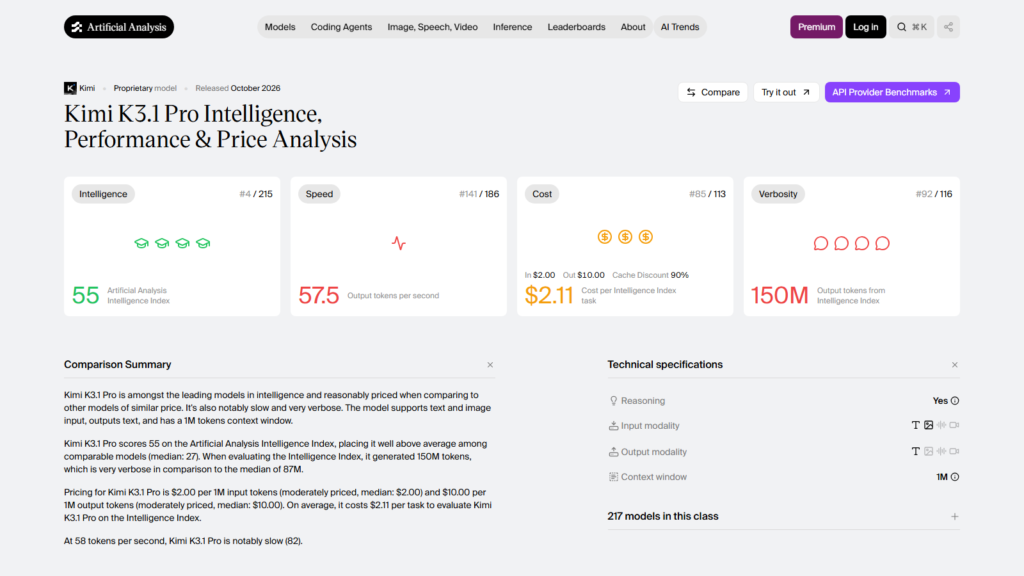
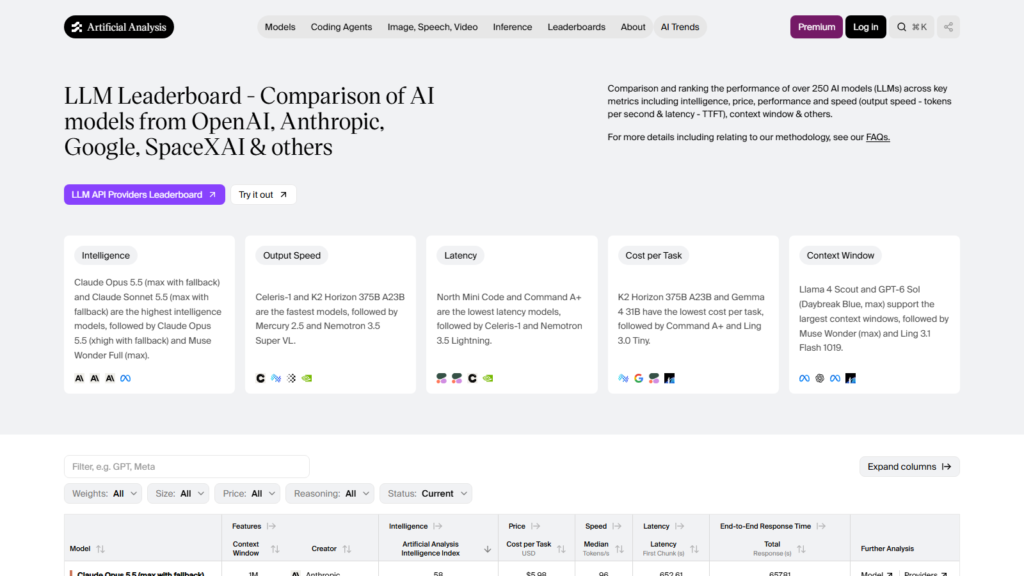
Kimi K3.1 Pro lands on Artificial Analysis’s Intelligence Index at 55.09, which is high enough to be a genuine frontier result and not high enough to be first. Three models sit above it: Claude Opus 5.5 at 57.62, Claude Sonnet 5.5 at 56.00, and Muse Wonder Full at 55.8. The gap from fourth place to first is 2.53 points on a 100-point index [INDEPENDENT, index v4.3.2, read 26 October]. On OrcaRouter the Kimi K3.1 Pro card mirrors that score and ranks it in the 95th percentile of the 149 models measured on the same index version, at $2.00 input and $10.00 output with no markup on the vendor’s list. So if you see a headline calling it the top model in the world, the number behind the headline is fourth, and the price behind the headline is the reason to keep reading.
That is not a disappointment. It is the most useful fact in the launch, because it tells you what kind of buying decision this is: not “the best model, cheap” but “a model within statistical noise of the top, at a fifth to a half of the price”. Everything in this article is about making that trade with your eyes open.
The top four, side by side
| Model | AA index | Input $/1M | Output $/1M | Blended 3:1 | Context |
| Claude Opus 5.5 (Max) | 57.62 | $4.00 | $20.00 | $8.00 | 1M |
| Claude Sonnet 5.5 | 56.00 | $2.00 | $10.00 | $4.00 | 1M |
| Muse Wonder Full (Max) | 55.80 | — | — | — | 1.05M |
| Kimi K3.1 Pro | 55.09 | $2.00 | $10.00 | $4.00 | 1M |
All four are within 2.53 points. Two of them — Kimi K3.1 Pro and Claude Sonnet 5.5 — are on exactly the same rate card, $2.00 and $10.00, which makes the pair the cleanest comparison in the field and the subject of its own article later in this series.
A caveat that belongs in the table rather than a footnote: effort settings are not identical across these rows. Opus 5.5 and Muse Wonder Full are measured at their maximum-effort configurations; Kimi K3.1 Pro is measured at its own default, which is also maximum effort, so the comparison is like for like in that respect. That is not true of every vendor table on the internet, and the next section is about why.
Why an index and a vendor table can disagree
The same week, Moonshot published its own benchmark table in which Kimi K3.1 Pro beats GPT-6 Astra by 7.5 points on Terminal-Bench 4.0 and loses to Claude Opus 5.5 by 0.7 [VENDOR]. The independent index says something narrower: Kimi is 2.42 points ahead of Astra and 2.53 behind Opus 5.5. Both sets of numbers can be honest, and the difference is in what they measure.
An index folds ten evaluations into one number. AA’s v4.3.2 runs AA-Briefcase, GDPval-AA, AutomationBench-AA, Terminal-Bench 4.0, SciCode, Humanity’s Last Exam, GDP.pdf, CritPt, AA-Omniscience and AA-LCR v1.1 [INDEPENDENT]. A vendor table typically picks the rows its model does well on, runs them with its own scaffold, and compares against competitor figures produced by the competitor on a different scaffold at a different effort level. Both are legitimate marketing. Only one of them is a shopping measurement.
The practical consequence: when a launch table and an index disagree about *who is ahead*, believe the index about the ordering and the vendor about the specific mechanism. Where the vendor says “65.7% on Terminal-Bench 4.0”, that is a real number produced by a real run. Where the vendor implies “therefore we are ahead of Opus”, that is a claim about two runs of a harness-sensitive benchmark, and the independent index declines to confirm it.
See also: Building a Consistent Process for Evaluating Emergency Dressings
What fourth place actually buys
Three sentences, one per axis.
On price, fourth place is the best position on the board. The model above it is twice the blended price. The two models it beats on price — GPT-6 Astra at 52.67 and Claude Fable 5.1 at 53.35 — are five times the blended price, and it outscores both [INDEPENDENT]. In index points per blended dollar, Kimi K3.1 Pro returns 13.8; Opus 5.5 returns 7.2; Astra returns 2.6.
On capability, 2.53 points is inside the range where a single evaluation can flip the ordering. On the ten-evaluation index, the models are close enough that a workload-specific benchmark will reorder them — which is exactly what happened in a private data-analytics test later in this series, where Kimi tied Grok 4.7 in third while two GPT-6 models tied for first.
On the components, the disagreements are not noise; they are systematic. Kimi K3.1 Pro leads the whole comparison set on long-context recall at 86.33% against Opus’s 84.67% [INDEPENDENT]. It trails badly on knowledge: AA-Omniscience 29.52 against Opus’s 46.42, a 16.9-point gap, with a hallucination rate of 43.89% against an accuracy of 51.02%. The composite says “within three points of the frontier”; the components say “reasoning close, recall ahead, knowledge behind”. Any deployment decision that reads only the composite is reading the average of two very different stories.
How to use a fourth-place score
If your task is extraction, transformation, code, or reasoning over material you supply in the prompt, the composite is the right lens and fourth place is a good buy: the model is within noise of the frontier at a quarter of the frontier’s blended cost, and the knowledge gap does not matter because the knowledge is in your context.
If your task depends on what the model knows when the context is empty — a factual answer, a citation, a domain fact — the composite is the wrong lens. The omniscience row is the one that governs, and there the model is 16.9 points behind Opus 5.5. The model’s own hallucination measurement is the number to design around: roughly 44% of its wrong answers are confidently wrong on knowledge tasks, and no amount of index score fixes that.
If your task is agentic and long-running, look at neither of those and look at Terminal-Bench and GDPval, where this model is unusually strong — first and third respectively in our comparison set, and the subject of separate articles here.
The honest summary of a 55: it is the score of a model that should be in every evaluation shortlist and should not be assumed to win any of them. Four models are within three points. Three of them cost two to five times as much. That is the entire decision, and it is more interesting than a leaderboard headline.
Sourcing note: every index score, component score, rate card and percentile is Artificial Analysis on index v4.3.2, read on 26 October 2026; the 149-model sample and the 95th percentile come from our own model card, which mirrors AA. The vendor comparison figures are Moonshot’s launch table, unreproduced. Effort configuration per row is stated where AA publishes it, and is the reason we do not compare an at-maximum score against a non-reasoning one.